Workplace Diversity
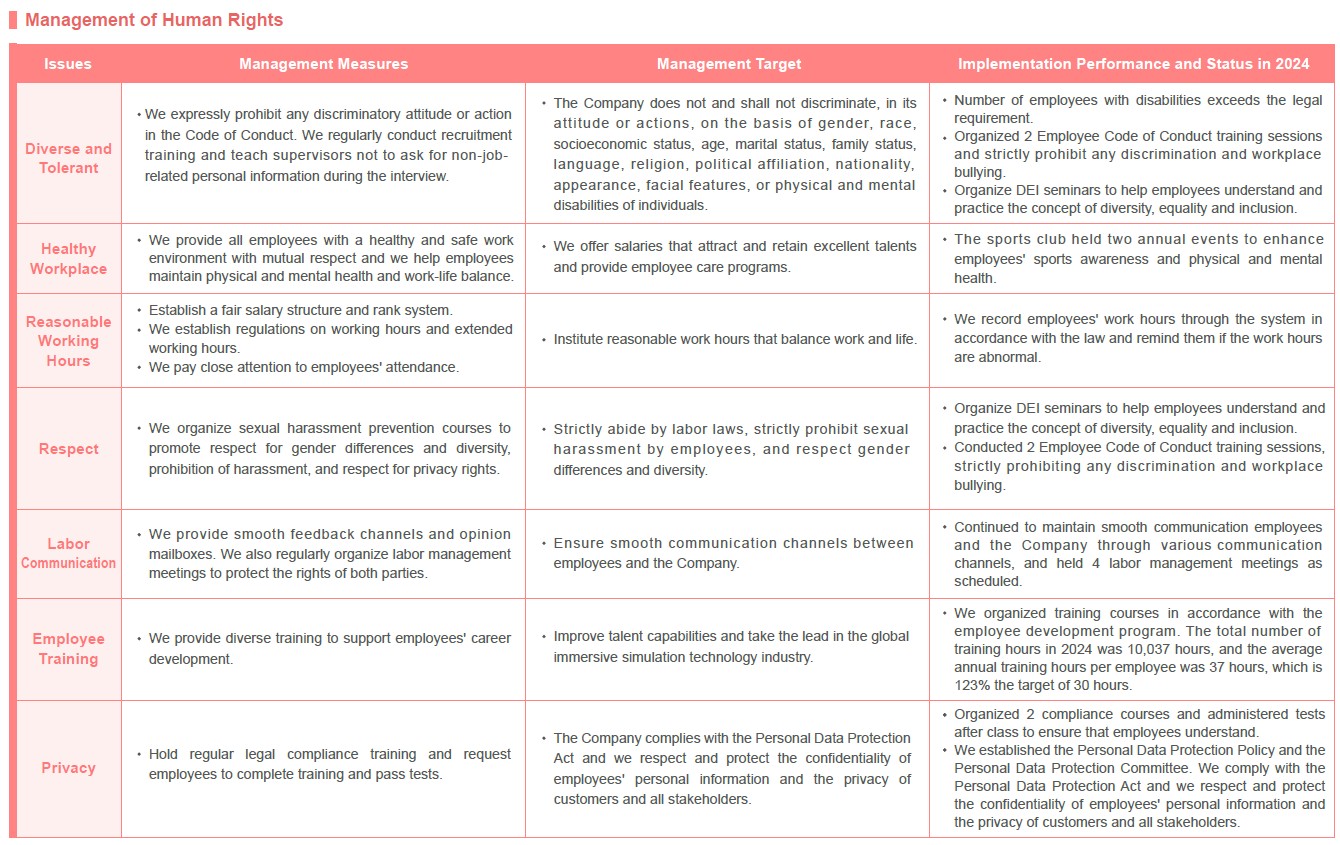
With "People" at the core of our company philosophy, we have created a happy, friendly, safe, and healthy working environment to unleash employees' potential, uphold integrity at work, and achieve outstanding performance. At the same time, Brogent formulated the "Human Rights Policy," which was approved and announced by the chairman, in accordance with international principles, such as the Universal Declaration of Human Rights, United Nations Guiding Principles on Business and Human Rights, United Nations Global Compact, and International Labour Organization. Brogent continues to shape a diverse and inclusive corporate culture. Whether it is hiring or promotion, it is not affected by personal gender, religion, race, or political inclination, creating a workplace of mutual respect and no harassment. The policy is applicable to all Brogent employees and relevant stakeholders. Brogent also invites all business partners, including suppliers and joint ventures, to jointly draw attention to human rights issues, in order to implement the Human Rights Policy and mitigate human rights risks. In addition, in terms of labor conditions and talent training, Brogent protects employee rights and supports employee career development by establishing reasonable working hours, smooth communication channels between labor and management, and diverse learning channels.
Human Resource Structure
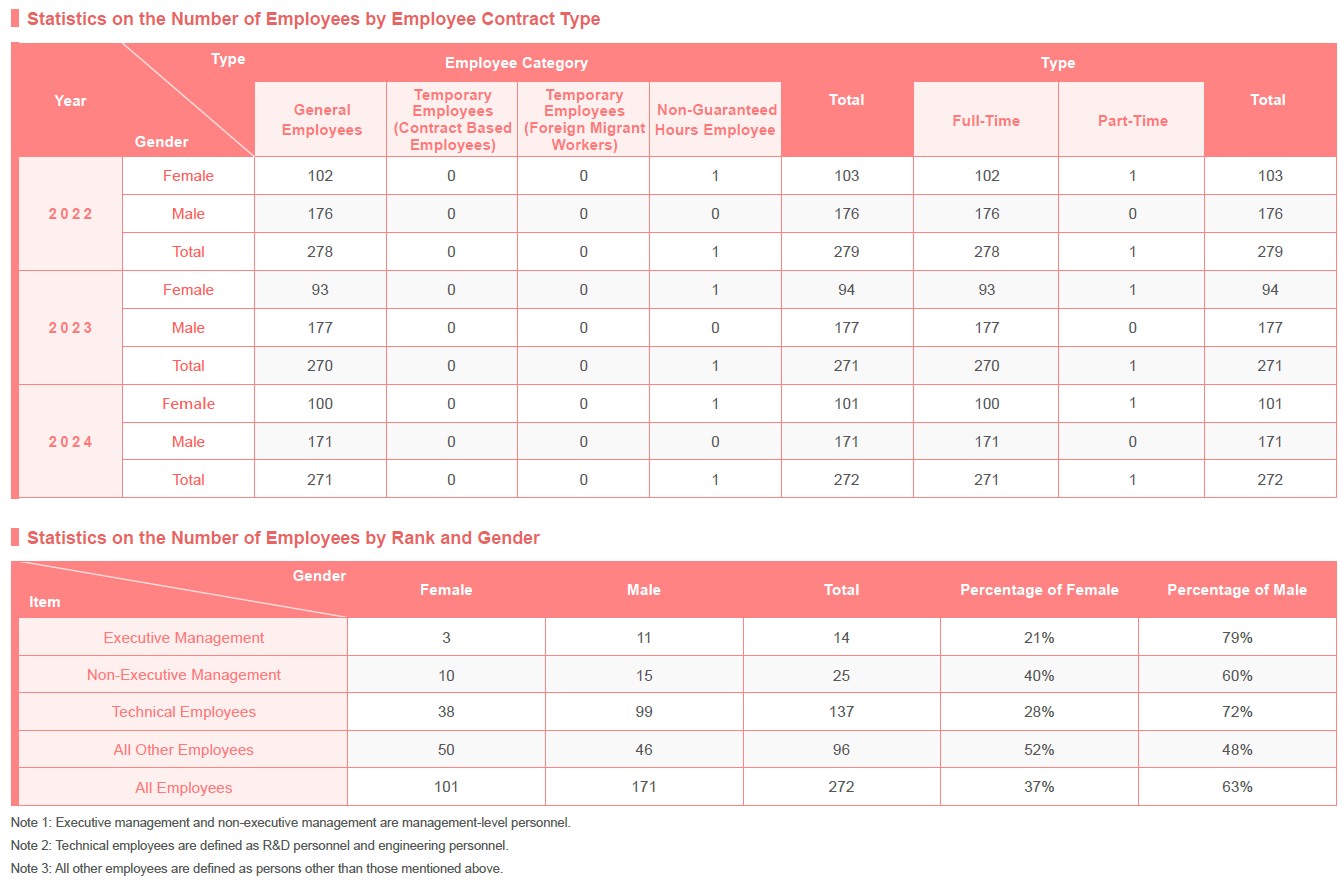
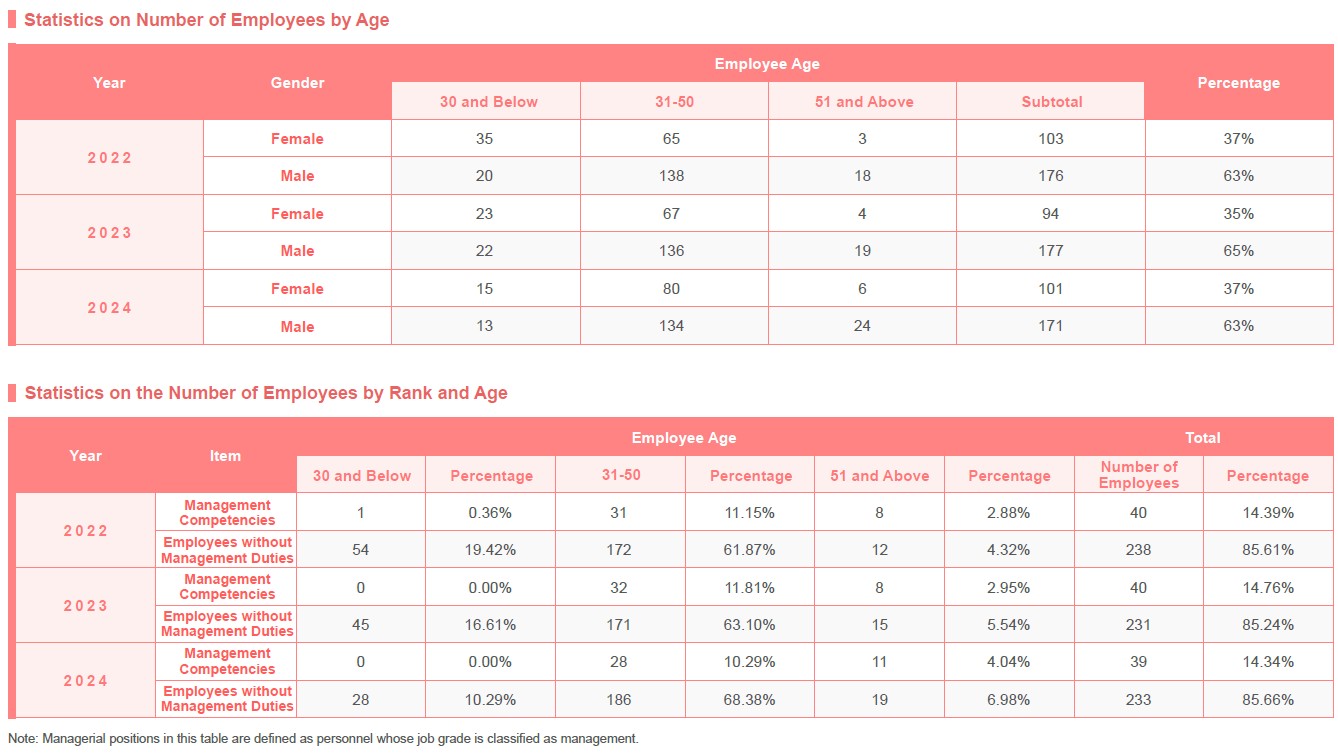
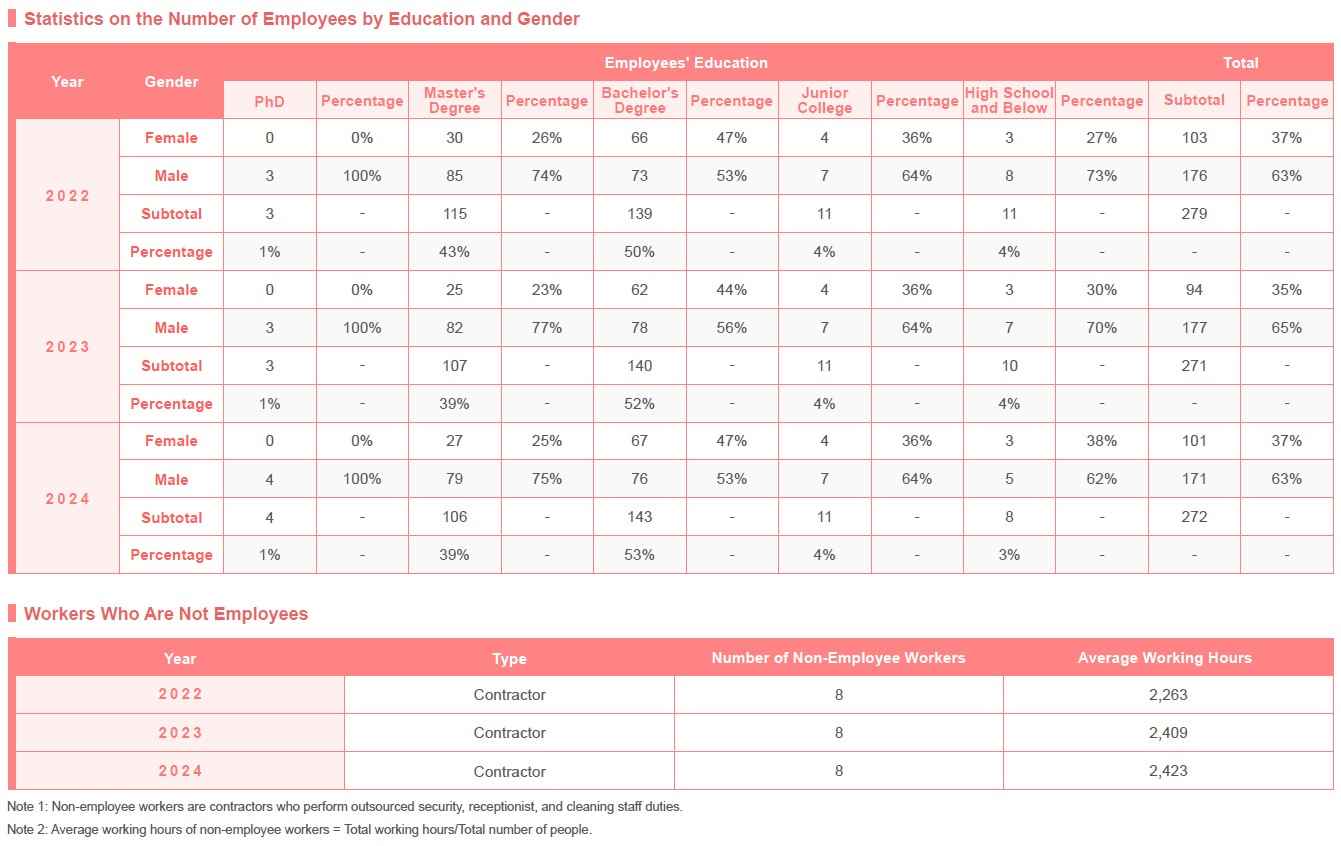
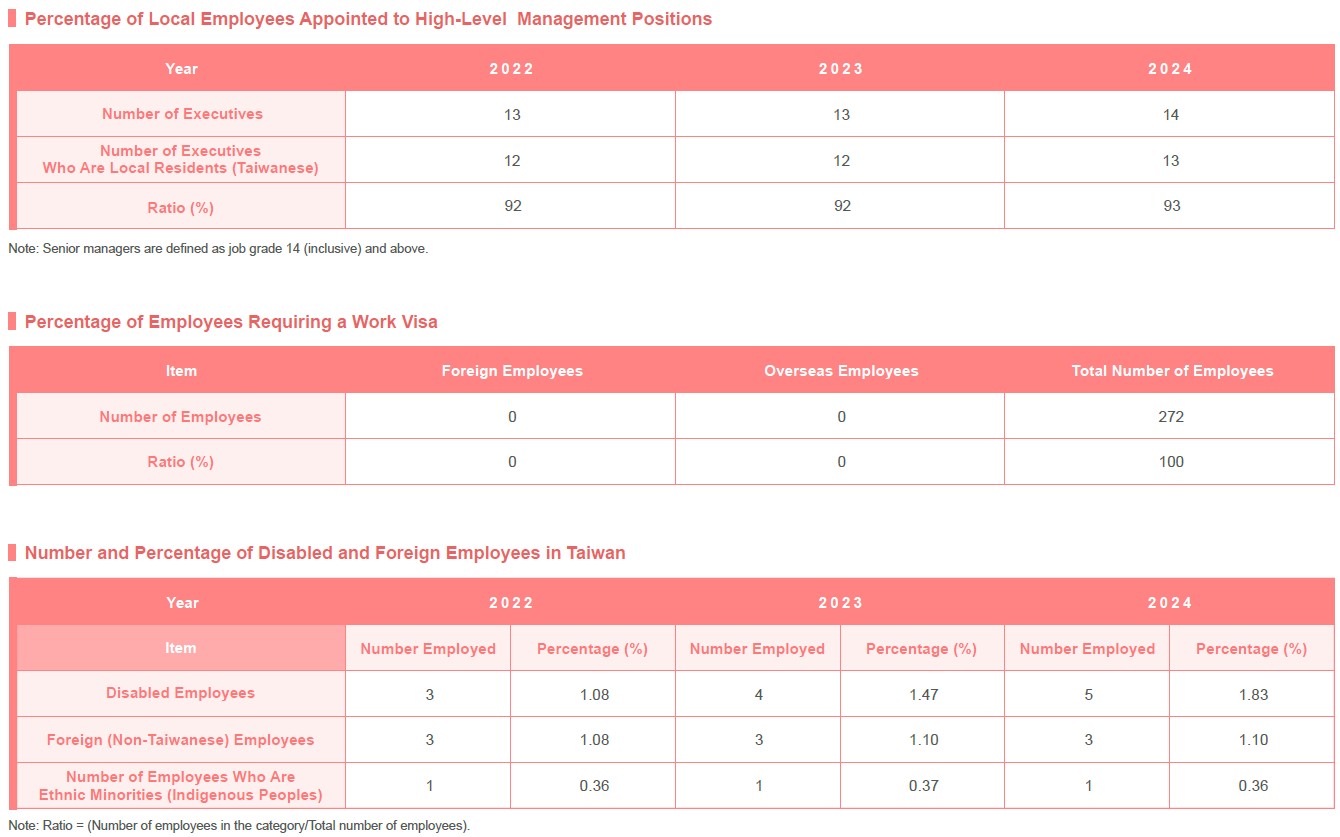
Brogent is a vibrant and innovative company that values employee diversity. Brogent's workforce overview is calculated as of the end of 2024, and includes the Kaohsiung headquarters, Manufacturing Center (Taoyuan Plant), and Taipei Office in Taiwan. The total number of employees is 272, of which 171 are male (63%) and 101 are female (37%). According to the classification of employee category, there are 271 full-time employees and 1 temporary employee; according to the classification of employment type, there are 271 full-time employees and 1 part-time employee. In addition to the above-mentioned formal employees, Brogent also hired 8 non-employee workers of various types according to business needs, who are mainly engaged in the security, receptionist and cleaning staff. Brogent hires local residents (Taiwan) in important sites of operations and they account for 93% of the top management.
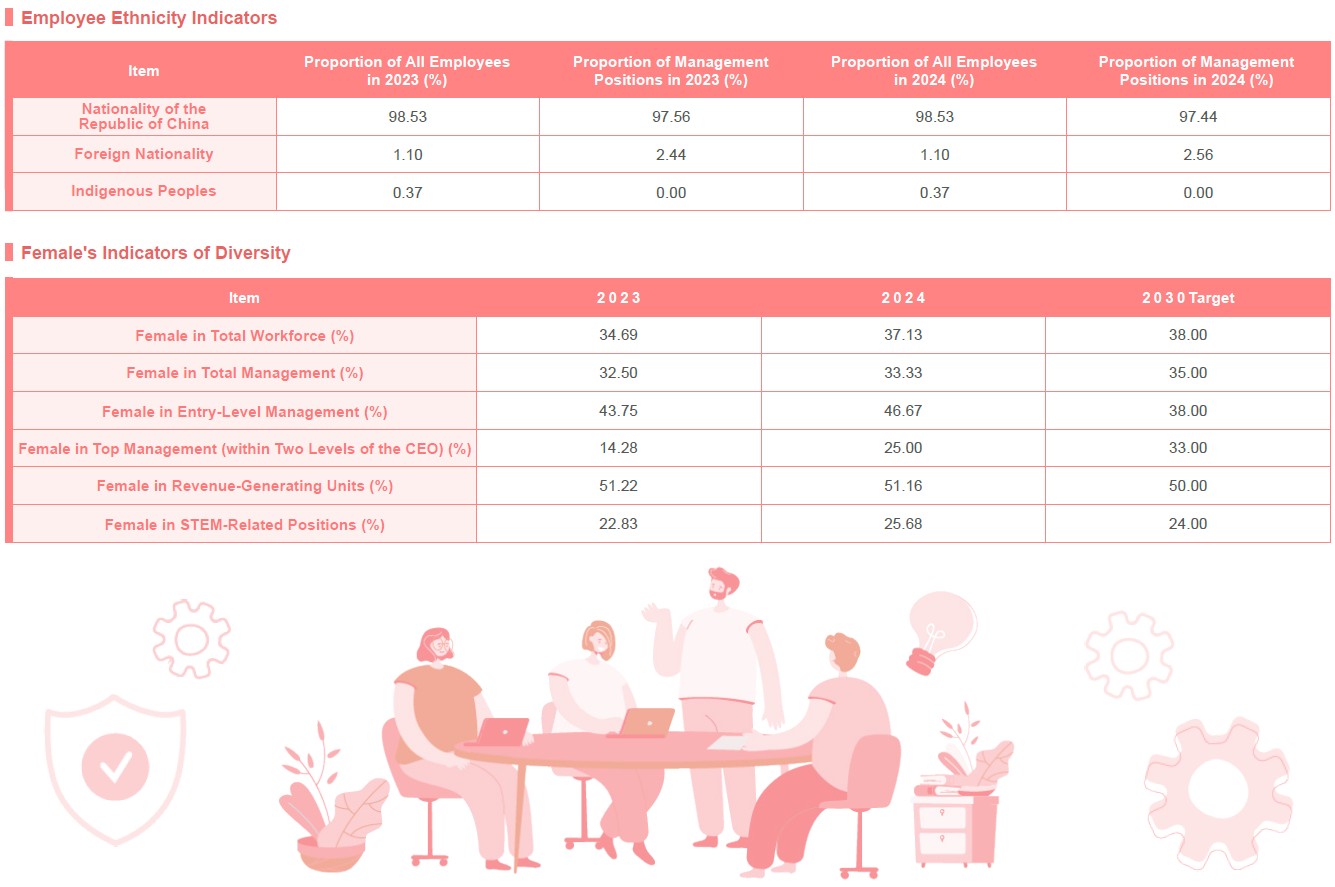
The composition of the diverse workforce includes 5 people with disabilities, 3 foreign employees and 1 minority (indigenous) employee. The number of people with disabilities hired by Brogent in 2024 exceeds the legal requirements, demonstrating the Company's implementation of equality and inclusiveness in the workplace, respect for the cultural customs of foreign employees, and provision of indigenous employees with the opportunity to apply for indigenous ceremonial leave every year to respect ethnic cultural differences and ensure cultural participation rights. Therefore, there has never been any violation of their right to work and human rights.
Highlights of Human Rights Promotion
Human Resource Structure
Brogent is a vibrant and innovative company that values employee diversity. Brogent's workforce overview is calculated as of the end of 2024, and includes the Kaohsiung headquarters, Manufacturing Center (Taoyuan Plant), and Taipei Office in Taiwan. The total number of employees is 272, of which 171 are male (63%) and 101 are female (37%). According to the classification of employee category, there are 271 full-time employees and 1 temporary employee; according to the classification of employment type, there are 271 full-time employees and 1 part-time employee. In addition to the above-mentioned formal employees, Brogent also hired 8 non-employee workers of various types according to business needs, who are mainly engaged in the security, receptionist and cleaning staff. Brogent hires local residents (Taiwan) in important sites of operations and they account for 93% of the top management.
The composition of the diverse workforce includes 5 people with disabilities, 3 foreign employees and 1 minority (indigenous) employee. The number of people with disabilities hired by Brogent in 2024 exceeds the legal requirements, demonstrating the Company's implementation of equality and inclusiveness in the workplace, respect for the cultural customs of foreign employees, and provision of indigenous employees with the opportunity to apply for indigenous ceremonial leave every year to respect ethnic cultural differences and ensure cultural participation rights. Therefore, there has never been any violation of their right to work and human rights.
Highlights of Human Rights Promotion
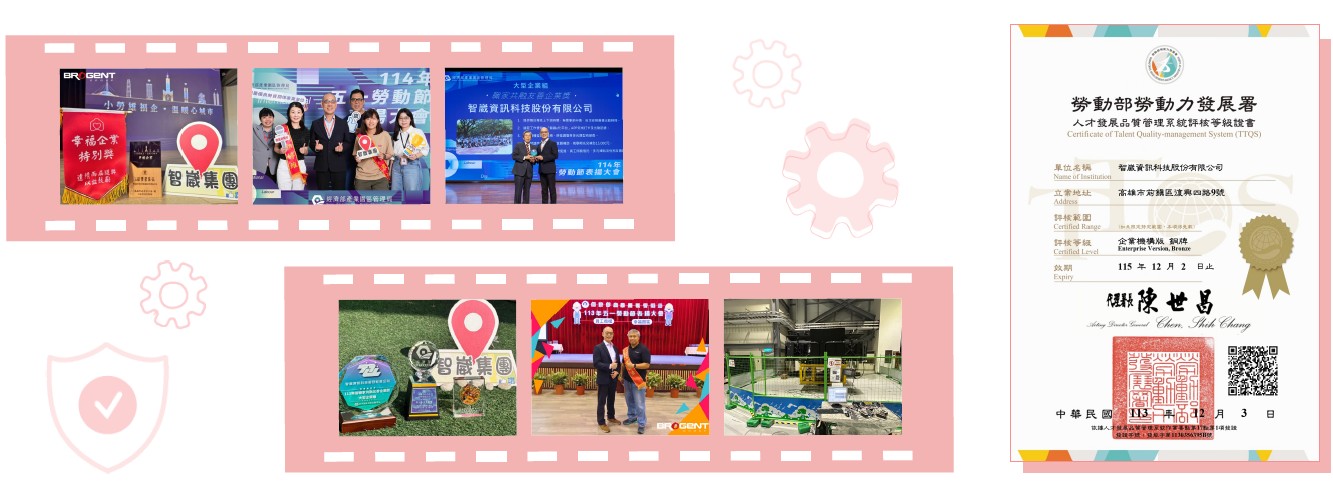
- Brogent used 9 public welfare deeds related to human rights promotion as supporting materials, and passed the review by members of the Export Processing Zone Administration, Ministry of Economic Affairs, which recognized Brogent as being enthusiastic about public welfare and having made significant contributions to public affairs of the park. It determined that Brogent's public welfare deeds are sufficient to serve as a role model, and awarded Brogent with the Public-spirited Award.
- Brogent strictly complies with labor laws, promotes the unity of labor and employment, coexistence and win-win goals, and promotes harmony between labor and management within the Company. It was awarded the "Excellent Enterprise Award for Labor Relations in Bureau of Industrial Parks, Ministry of Economic Affairs."
- Brogent has set a new benchmark for warm-hearted enterprises by treating workers well, and was recognized by the Kaohsiung City Government with the "Happy Enterprise Award for Small Enterprises with Outstanding Labor Welfare Group A Enterprises (Employing more than 100 employees)" and was specially awarded the "Willing Heart Award" which is a recognition that Brogent has been selected as a happy enterprise for two consecutive years, demonstrating its long-term and continuous care and commitment to employees.
- Brogent is committed to creating an inclusive and friendly workplace atmosphere, attaching importance to the balance between employees' work and family life, demonstrating a high level of care and practice for employee welfare. It was recognized by the large enterprise group of the "Bureau of Industrial Parks, Ministry of Economic Affairs Work-Family Integration Friendly Enterprise Award".
- Brogent is committed to deepening talent development and actively built a comprehensive learning and development mechanism. It was awarded the Bronze Certificate of TalenT Quality-management System (TTQS) by the Workforce Development Agency, Ministry of Labor, which symbolizes Brogent's continuous improvement and excellence in training system and talent development.
- Brogent attaches great importance to the safety of the workplace environment. After conducting a self-inspection of the environment, we set up safety protection measures for the testing site (type B fences, surveillance cameras, emergency stop buttons, etc.), and took various safety protection measures (covered sharp angles, strengthened the solder joints of handrails, cut roller screws that are too long, etc.) to protect employees' work safety.
- Optimize the 5S management of the test site, regularly inspect the safety of various operations and electrical equipment in the site, and implement a mechanism for sorting, setting in order, and sweeping to establish a safe and comfortable workplace.
Salary and Benefits
At Brogent, we consider our employees to be our most important asset. We have strived to provide our employees with a competitive compensation and benefits package. This package protects their rights to participate in labor and health insurance, as well as contribute to their labor pension. Our performance management system combines the objectives of our company's operational performance and employees' personal performance. We review our employees' performance to provide them with the opportunity to become promoted or receive other incentives. They are placed in their ideal positions to create a happy learning environment and enhancing their development.
Equal and Competitive Salaries
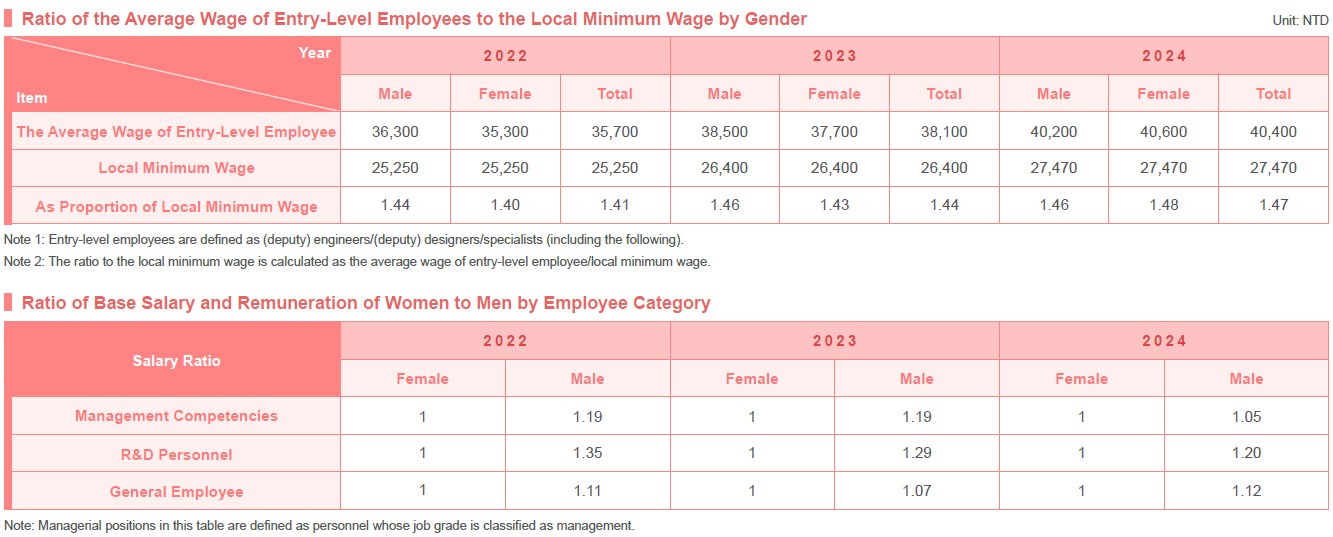
The scope of Brogent's salary and compensation data disclosure includes Kaohsiung headquarters, Manufacturing Center (Taoyuan Plant) and Taipei office in Taiwan; in order to attract and retain outstanding talents and maintain competitiveness in the external market, the Company will adopt a substantial salary adjustment policy for employees in 2024. The average wage of entry-level employees was approximately 1.47 times the Taiwan minimum wage in 2024.
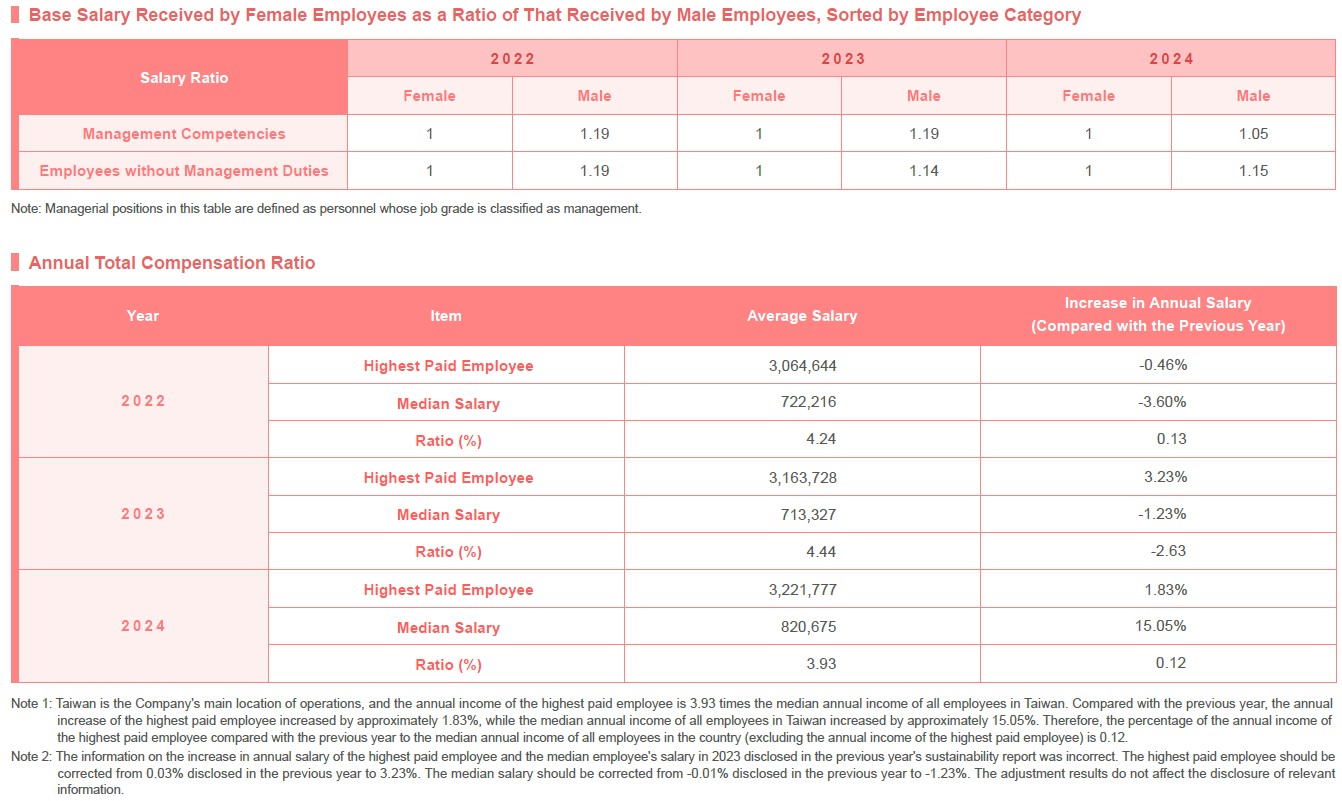
Brogent adheres to the principle of equal pay and actively implements equal pay for equal work for male and female to ensure that all employees are treated equally based on gender. Its compensation bonuses are based on performance as the basis for granting year-end bonuses and determining employee remuneration, and it provides employees with reasonable and promising salaries. In 2024, there was a slight difference in the salary ratio between male and female. The reason is that male employees accounted for the majority of the R&D and technical workforce, and their educational backgrounds are different, so the average salary of male employees is slightly higher than that of female employees. However, ratio of base salary and remuneration of women to men in non-managerial positions decreased from 1.19 in 2023 to 1.05 in 2024, demonstrating that Brogent continues to work hard to realize the principle of pay equality.
Benefits and Flexible Systems
Brogent is committed to providing diverse and flexible employee benefits, including insurance, bonuses, training, leisure, and convenience benefits, which cover actual needs for food, clothing, housing, transportation, education, and entertainment, allowing employees to pursue work-life balance. The Wedding, Funeral, Hospitalization, and Emergency Relief Management Regulations provide employees with necessary assistance and care in times of crisis.
Employees express their opinions and needs through various communication channels, such as the Welfare Committee and labor-management meetings. Brogent listens to the voices of employees and references them when planning annual employee welfare activities and designing and adjusting subsidy programs. In the future, we will continue to provide a variety of welfare measures for a friendly workplace and physical and mental health, and provide EAPs for different groups, in order to more comprehensively take care of employees.

1. Comfortable Working Environment
- Provide employees with a spacious and comfortable office environment and a recreational sports center.
- Provide employee health management equipment, such as blood pressure monitors, scales, etc.

2. Insurance and Protection
- In compliance with the law, new employees are signed up for labor insurance and national health insurance on their first day of work.
- Provide employee group insurance, life insurance, hospitalization and accidental injury medical expense claims and other health
- insurance, and allow dependents to join group insurance at their own expense.
- Provide Group Business Travel Accident Insurance so that employees can seek relevant claims (such as medical treatment, disability, death, overseas emergency assistance or luggage loss/delay, etc.) and obtain full protection in the event of accidents or emergencies during domestic and international business trips
3. Services and Facilities
- Flexible working hours and free coffee, snacks, and postal services every day.
- Employee parking spaces for cars and scooters, lactation rooms, unisex toilets.
- Microwaves and fridges are placed on each floor.
- We provide employees with the option for remote work and they may file application based on their personal needs.
- In compliance with government policy, Brogent has made effort to help employees in need apply for parental leave, supporting them during this important stage of their life.
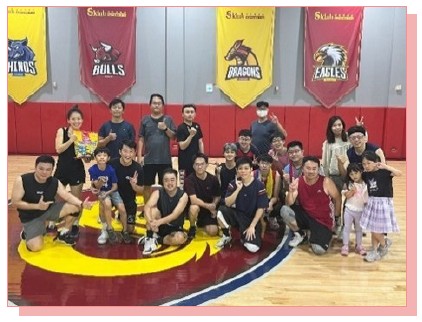
4. Employees Encouraged to Form Clubs
Brogent provides subsidies for various club activities. Employees can apply to establish a club if there are more than 5 members. Employees can choose to join their favorite clubs according to their personal interests, such as basketball, baseball, badminton, and many other choices. Brogent's Employee Welfare Committee will subsidize the club funds every month according to the number of club members. If the club participates in external competitions, it will also provide partial registration fee subsidies.


5. Other Benefits
- Employee Stock Ownership Trust: The "Employee Stock Ownership Trust" was launched in 2021. Brogent will subsidize 100% of the self-withdrawal and provide employees with an attractive dollar-cost averaging stock investment plan. Brogent is open to all employees to participate freely, allowing employees to enjoy the steady returns of shareholder value and coexist with the Company; all employees who have passed the three-month new employee probation period are eligible to participate. By the end of 2024, the employee participation rate exceeded 90%.
- Wedding, funeral and hospitalization benefits: Relevant subsidy items include wedding gifts, childbirth or spouse childbirth gifts, injury and illness hospitalization condolence money, and funeral expenses for the death of immediate family members. In 2024, the company subsidized a total of 19 people.
- Company Trip: In order to enhance employees' understanding of simulator rides, Brogent organized 9 batches of company trip combined with education and training courses in 2024, to experience the "Bermuda Storm" in the famous theme park in Zhuhai, which not only enhances communication among employees, but also helps to broaden their horizons; this time, the company fully

Reliable Retirement Program
The retirement pension plan Brogent has for its employees include benefits stated in Taiwan's "Labor Standards Act" and the appropriate plan stated in the "Labor Pension Act". At the same time, an "Employee Stock Ownership Trust" is open for participation by all employees so that employees are covered by a comprehensive benefit policy with the aim of retaining talents and taking care of employees' financial needs upon their retirement.Employee pensions are calculated based on years of service and the average salary in the six months before retirement. Brogent compiles with the Labor Pension Act enacted by the government, and allocates 6% of employees' monthly salaries to their individual labor pension account at the Bureau of Labor Insurance.
Employee-Oriented Company
Brogent is people-oriented based on the belief that employees are the Company's "assets," providing an inspiring mission and vision, making employees feel the value of work, and creating a happy, friendly, safe, and healthy working environment. We create an atmosphere of learning and development through the human resources policy of selection, education, employment, and retention, helping employees self-improve, and placing them in the right position to fully utilize their talents and grow together with the Company.
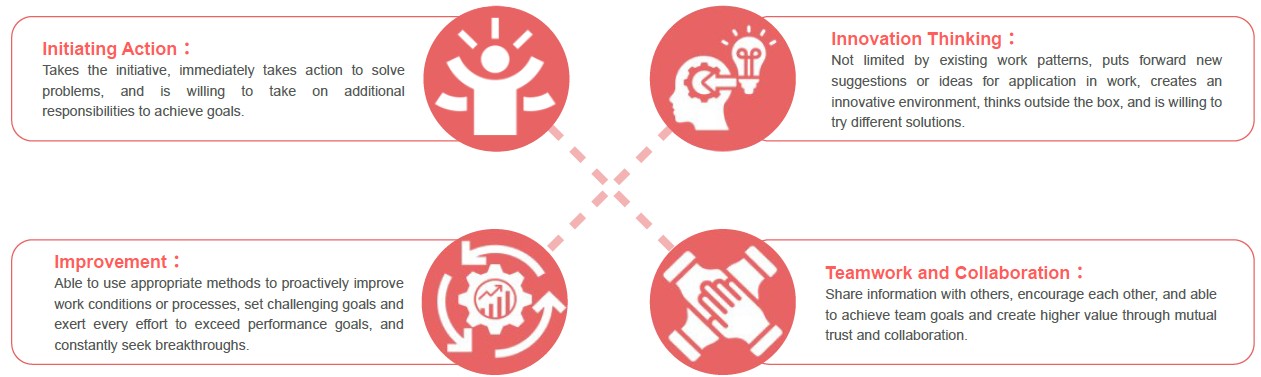
We have developed four core competencies and one management competencies that are suitable for the Brogent Group. At the end of each year, we conduct a function development assessment to understand the level of our employees' core competencies, organize education and training or policy activities to enhance their competencies, and value the internal career development of our employees, in order to cultivate talents with sustainable competitiveness.
Brogent's Core Competencies
Brogent's Management Competencies

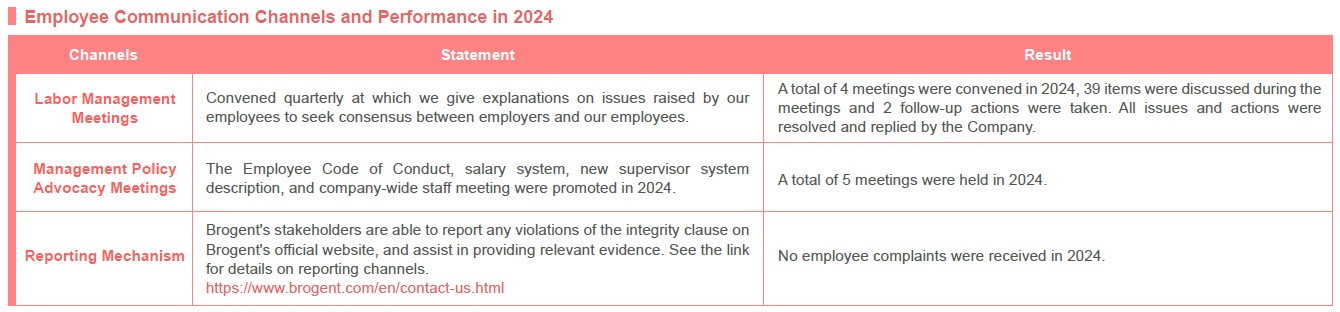
Labor Communication
Brogent actively manages labor relations and maintains harmonious and smooth communication between labor and management through multiple channels. Labor management meetings are convened in accordance with the Regulations for Labor-Management Meeting, even though there is no labor union and collective bargaining agreement. Meetings to promote related systems are irregularly held to communicate work-related clauses and employee rights and interests. We have established a smooth and effective appeal mechanism for employees to ensure the equality and transparency of the appeal procedure. We have also actively responded to and handled employee complaints. There have been no employee complaints at Brogent in the last five years.
Brogent established a Welfare Committee to actively initiate communication, care for employees' needs, and provide employees with multiple welfare options. Besides holding at least 2 investor conferences each year to explain the Company's operating status to investors, employees, and the general public, "labor-management meetings" are also held each quarter to report the Company's operating status to employees. Ad hoc meetings are held for immediate communication when necessary. In the event of significant operational change that requires the termination of employment of certain employees, the Company shall provide advance notice in accordance with the regulations of each operation site.